Posts

Showing posts from October, 2012

SAP BO 4.0 Open Document

Talking about Open document there are several features that changed in the new Business Intelligence platform 4.0. changed compared to XI R3.1 version. Let's see some hints: The default URL to the OpenDocument web application bundle has changed in SAP BusinessObjects Business Intelligence platform 4.0. New absolute OpenDocument links need to use the new default URL: http:// : /BOE/OpenDocument/opendoc/openDocument.jsp? & &...& Below you will see a lists of deprecated and obsolete OpenDocument parameters as of SAP BusinessObjects Obsolete parameters are no more supported. sIDType=GUID    ->  Use sIDType=CUID instead. sIDType=RUID     ->   Use sIDType=CUID  instead. sKind                    -> Use iDocID instead.          Specifies the SI_KIND property of the target                                                                        Desktop Intelligence document. sPath                              sPath does not support the use of lo

SAP BO 4 - Live Office

Image
Life Office purpose To use Live Office to access corporate data,  you must connect to the SAP BusinessObjects Business Intelligence platform repository where documents are stored. When you attempt to search for, add, view, modify, or publish Live Office objects from a Microsoft Office application, if you are not already logged on to the BI platform, you are prompted to log on. You can configure Live Office to connect to SAP BusinessObjects Business Intelligence platform automatically each time Microsoft Office Excel, PowerPoint, Outlook, or Word is loaded. Live Office supports Single Sign-on (SSO) to the BI platform. If SSO is enabled, when users request report data, Live Office uses their SAP BusinessObjects Business Intelligence platform logon credentials to access the data source rather than requiring another logon. Live Office object types Crystal Reports ->  Fields: Yes   Report Parts: Yes Web Intelligence ->  Fields:  Not applicable  Parts: Yes U

Lifecycle management console & BO Dashboard

Image
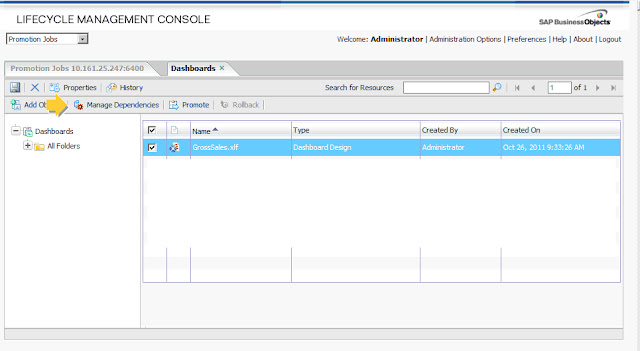
In the Lifecycle Management Console, the new Dashboard Objects allows to check relashionship with universe query, dependences on QaaWS and universe objects in QaaWS connections, and/or dependences on WebIntelligence reports, Crystal reports and Universe objects with Life Office Connections. All the dependent objects can be promoted together. See also: Lifecycle Management Console LCM Managing infoobject versions How to import or export with lifecycle from cmd line

SAP BO Dashboards 4 - Binding chart to the query objects

Image
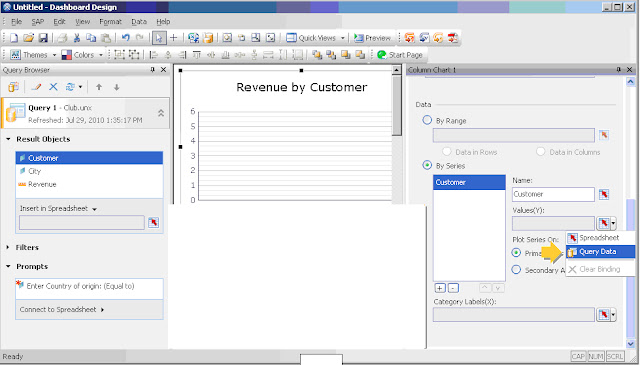
Binding chart to the query objects The great  new feature in SAP BO Dashboards allows to bind every single component of the dashboard  (charts, gauge and so on) directly to the query on the universe, this operation avoids to import values on the sheet in order to map    the component. Please note that when data is directly bound to a chart or other component this object will not display data in Design mode so you need to preview or publish the dashboard in order to view data. New components for Universe Connectivity: Query prompt selector  enables users to select one or more values for the prompt accordfing the operator used in the query. Please note that when a prompt selector is dragged to the canvass automaticcally it is added to the dahsboard. Query refresh button this allows users to refresh  data directly on demand in the dashboard   In SAP BO Dashboards 4.0 is now possible to  apply a   dynamic regional date, time, currency and numb

SAP BO DASHBOARDS 4.0 New Features

Image
SAP BO DASHBOARDS 4.0   Servers In SAP Business Objects BI 4, BO Dashboard has been integrating in CMC management (auditing and monitoring included) as concerns the management of two new servers: DashboardDesignCacheServer DashboardDesignProcessingServer which support better performance and scalabilty. the first server provides data caching and sharing while the second manages query processes requests A great new feature of SAP BO Dashboard 4.0 is provided by the direct connection to a Universe trough a Query panel , the user interface is like WebI one so objects like dimensions and misures can be selected directly, besides you can apply filters,  sorts, prompts and you can preview the query data. The query  browser panel enables the dashboard designer to manage query on the universe, displaying the summary of result obejects, prompts and filters for each query launched providing in this way a quick access to tool to create, edit and refresh queries.

BO Dashboards 4.0 Supported Excel functions

SAP BusinessObjects Dashboards 4.0 Supported Excel functions The SAP BO  Dashboards 4.0   supports the following Excel functions: A ABS ACOS ACOSH ADDRESS AND ASIN ASINH ASSIGN ATAN ATAN2 ATANH AVEDEV AVERAGE AVERAGEA AVERAGEIF B BETADIST C CEILING CHAR CHOOSE COLUMNS COMBIN CONCATENATE CORREL COS COSH COUNTIF Note: If used with large data sets, this function could affect performance. COUNT COUNTA COVAR D DATE DATEVALUE DAVERAGE DAY DAYS360 DB DCOUNT DCOUNTA DDB DEGREES DEVSQ DGET DIVIDE DMAX DMIN DOLLAR DPRODUCT DSTDEV DSSTDEVP DSUM DVAR DVARP E EDATE EFFECT EOMONTH EVEN EXACT EXP EXPONDIST F FACT FACTDOUBLE FALSE FIND FISHER FISHERINV FIXED FLOOR FORECAST FV G G GE GEOMEAN GT H H HLOOKUP  Note: If used with large data sets, this function could affect performance. HOUR HARMEAN I I IF INDEX INT INTERCEPT IPMT IRR ISBLANK ISERR ISERROR ISEVEN ISLOGICAL ISNA ISNONT

SAP BusinessObjects Dashboards 4.0 - Spreadsheets

How to prepare Excel spreadsheets Before you import an Excel spreadsheet, make sure the spreadsheet provides a good structure for achieving the best performance for models. Consider the following guidelines: - Use only supported Excel functions For a list of supported Excel functions, see Supported Excel functions . - Use these Excel functions with small data sets only The following Excel functions are supported in Dashboard Design and Presentation Design, but can affect the model's performance if used with larger data sets (over 100 rows): • SUMIF • COUNTIF • HLOOKUP • VLOOKUP Note: If you must access larger data sets, have the server or database perform the aggregation on the server side. - Organize your data in a logical fashion To make your spreadsheet easier to understand, lay out your data in a logical fashion. Group related items together and use colors, labels, and borders to describe the structure and function of cells. - Use colors

Error UNV0011 - Cannot load linked universes

Environment: BO XI R3.x After a migration from  BO  6.5 After creating  new users to wich have been given Deski rights to access to few universes in order to create reports. When they log in into Deski they see the universes but cannot open them from the query panel because an error occurs:  " Cannot load linked universes (UNV0011)". It looks like the Universe to which has been given access to has been linked to another Universe. Solution: Logon on CMC as    Administrator and give to universe which gave error  the same rights to the linked Universe in this way you can solve the above error. Hope this helps. See also: BUSINESS OBJECTS ERRORS LIST

Error DX0005 - Cannot open document - Solution

Environments:   BOE XI R 3.1 + FP1  BOE XI R 2 + SP3 In order to solve the problem: 'Failed to import document. (DX0005)' or Cannot open document (Error: INF))  that occurs when viewing Deski reports through InfoView   the resolution was to grant the Everyone group the following rights under Applications -> Desktop Intelligence: - Log on to Deski and view this object in the CMC - Copy to Clipboard - Retrieve Documents - Refresh List of Values - Deski report interaction - Deski document interaction - Refresh Deski document - Refresh list of Categories Hopes this Help! See also: BUSINESS OBJECTS ERRORS LIST

Sizing guide for SAP HANA

Sizing the RAM needed Sizing an SAP HANA system is mainly based on the amount of data to be loaded into the SAP HANA database, because this determines the amount of main memory (or RAM) needed in an SAP HANA system. To size the RAM, the following steps have to be performed: 1. Determine the information that has to be transferred (either by replication or extraction) to the SAP HANA database. Note that typically customers will only select a sub-set of information from their ERP or CRM database, so this has to be done at the table level. The sizing methodology is based on uncompressed source data size, so in case compression is used in the source database, this has to be taken into account as well. The information required for this step can be acquired with database tools. SAP Note 1514966 contains a script supporting this process for several database systems, for example, DB2 LUW and Oracle. The current size of all the tables (without DB indexes) storing the required information

T-shirt sizes for SAP HANA

Image
T-shirt sizes for SAP HANA SAP defined so-called T-shirt sizes for SAP HANA to both simplify the sizing and to limit the number of hardware configurations to support, thus reducing complexity. SAP’s hardware partners provide configurations for SAP HANA according to one or more of these T-shirt sizes. In addition to the T-shirt sizes listed in Table, you might come across the T-shirt size XL, which denotes a scale-out configuration for SAP HANA. The T-shirt sizes S+ and M+ denote upgradable versions of the S and M sizes: S+ delivers capacity equivalent to S, but the hardware is upgradable to an M size. M+ delivers capacity equivalent to M, but the hardware is upgradable to an L size. These T-shirt sizes are used when relevant growth of the data size is expected. For information about RAM sizing : Sizing the RAM for SAP HANA

SAP HANA database

SAP HANA database The heart of the SAP HANA database is the relational database engines. There are two engines within the SAP HANA database: - The column-based store, storing relational data in columns, optimized holding tables with huge amounts of data, which are aggregated and used in analytical operations. - The row-based store, storing relational data in rows, as traditional database systems do. This row store is more optimized for write operation and has a lower compression rate, and query performance is much lower compared to the column-based store. The engine used to store data can be selected on a per-table basis at the time of creation of a table. Tables in the row-store are loaded at startup time, whereas tables in the column-store can be either loaded at startup or on demand, during normal operation of the SAP HANA database. Both engines share a common persistency layer, which provides data persistency consistent across both engines. There is page manag

SAP HANA Architecture and terms

Image
When talking about SAP HANA , these terms are used: SAP In-Memory Appliance (SAP HANA) SAP HANA is a flexible, data source agnostic appliance that allows you to analyze large volumes of data in real time, without the need to materialize aggregations. It is a combination of hardware and software, and it is delivered as an optimized appliance in  cooperation with SAP’s hardware partners for SAP HANA. SAP in-memory database , also referred to as the SAP HANA database The SAP in-memory database is a hybrid in-memory database that combines row-based, column-based, and object-based database technology, optimized to exploit the parallel processing capabilities of current hardware. It is the heart of SAP offerings like SAP HANA. For more detailed information see Sap Hana Database SAP HANA architecture See Also: In memory key concepts SAP HANA - Data persistence Sap Hana introduction SAP HANA - Additional Components

XCELSIUS SALES DASHBOARD TEMPLATE

Image
Let's see how you could organize  a Dashboard concerning Sales In the home page it's possible to analize the summary situation about: Brand Income and incidence Monthly Comparison Income Vs Budget Current Year Income vs Last Year Income (gauge ) Current Year Income vs Budget  (gauge ) Weekly trend Current Income, Budget, Last year Income Geographical Maps Shows Income vs Budget vs Last year Income for the selected Country Store Page Allow to select a country and a specific Store sign: in order to analize the summary situation about : Brand Income and incidence Monthly Comparison Income Vs Budget Current Year Income vs Last Year Income (gauge ) Current Year Income vs Budget  (gauge ) Weekly trend Current Income, Budget, Last year Income Others Dashboards template: Xcelsius Dashboard template files World Sales Dashboard template For detailed information please see: Sap Dashboard -Xcelsius 2008 Sap BO dashboards 4.0 New features

SAP BI MOBILE REPORTS for IPAD

Image
Let's see some other example about how to use SAP BI MOBILE features in  order to create attractive reports: First of all in orther to create a SAP  BI MOBILE report you have to create a WebIntelligence report containing the features and charts you need to show on IPAD. In this following case you can navigate trough the pie chart either with the selector on the pie or clicking on the arrows to the left or to the right  of % value label. Inserting a  Tabel a summary values block and relative trend chart in IPAD Report In following image you can see how a column chart appears on Ipad See also SAP BI MOBILE for IPAD Using OpenDoc in SAP BI MOBILE for IPAD - IPHONE Web Intelligence Layout for BI Mobile documents SAP BI MOBILE for Android SAP Dashboards for IPAD

SAP HANA - In memory Key concepts

Image
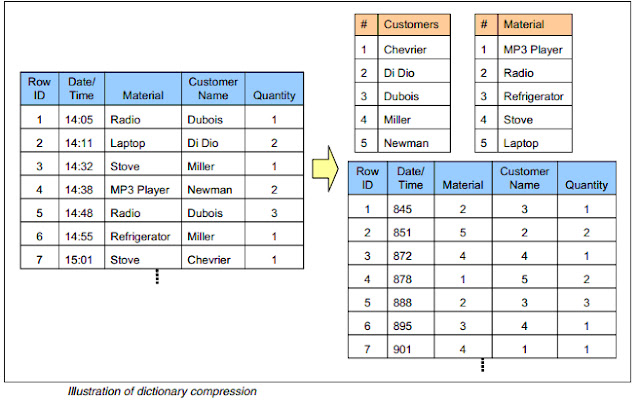
Minimizing data movement The second key to improving data processing performance is to minimize the movement of data within the database and between the database and the application.  This section describes measures to achieve this target. Compression Even though today’s memory capacities allow keeping enormous amounts of data in-memory, compressing the data in-memory is still desirable. The goal is to compress data in a way that does not use up performance gained, while still minimizing data movement from RAM to the processor. By working with dictionaries to be able to represent text as integer numbers, the database can compress data significantly and thus reduce data movement, while not imposing additional CPU load for decompression, but even adding to the performance. On the left-hand side of this  figure  the original table is shown containing text attributes (that is, material and customer name) in their original representation. The text attribute

SAP HANA - Data persistence

Image
Data persistence in SAP HANA Keeping data in main memory brings up the question of what will happen in case of a loss of power. In database technology, atomicity, consistency, isolation, and durability (ACID) is a set of  requirements that guarantees that database transactions are processed reliably: A transaction has to be atomic. That is, if part of a transaction fails, the entire transaction has to fail and leave the database state unchanged. The consistency of a database must be preserved by the transactions that it performs. Isolation ensures that no transaction is able to interfere with another transaction. Durability means that after a transaction has been committed it will remain committed. While the first three requirements are not affected by the in-memory concept, durability is a requirement that cannot be met by storing data in main memory alone. Main memory is volatile storage. That is, it looses its content when it is out of electrical power. To make data

Xcelsius - Using Query as Web Services in a Dashboard

Image
How to create a Query As A Web Services  Open the BO tool Query As A Web Services from Programs -Business Objects  Log on Business Objects  Server  Insert the  Web Services url: http:/SERVERNAME:8080/dswbobje/services/Session Give a name to the Web Service Assign value to advanced parameters: Select the Universe on wich you need to create a query: Create your query selecting the available objects in the universe After executing the query will appear a data preview Finally you have to publish the query on CMS Now open Xcelsius 2008  and Create a Connection  to a QAAWS After this Xcelsius will retrieve data in order to create charts and all the Dashboard objects: Xcelsius & SAP Dashboards Sap BO dashboards 4.0 New features

How changed Security Rights between Business Objects 3.x and 4.0.

Security rights  removed or missing rights in BI  4.0 Modes are enabled, all tools and panels are visible, but their use depends on the actual user’s rights. Removed from all clients: Queries: Enable Drill Mode and Extend scope of analysis -These rights are no longer managed. Interface: Ability to hide / show toolbars -The toolbar is replaced by toolboxes which are always visible. Interface: Enable toolbox and menu items - Entire toolboxes cannot be deactivated. All menu items are always visible.Menus are controlled by security right linked to the actions offered. Menu items are grayed when the user does not have sufficient priviledges to use those items. Interface: Left pane - Enable available objects, tables and charts -  The left pane items are always available  Interface: Left pane - Enable data summary - The data summary is always available Removed right in 4.0 Web Intelligence Web interface Enable HTML Report panel - This viewer and related security rights ha